Tides graphs click the name of where you
are going for the tide
where you plan to fish.
These are two day graphs for each location. today & tomorrow
{ Temporarily not working Sorry }
Venice Inlet Stump Pass
Lemon Bay Placida / Gasparilla Pass
Boca Grande Pass Pine Island
Captiva Pass Pine land
Red fish Pass El - Jo- Bean
Punta Rassa San Carlos bay
Caloosahatchee River Matlacha / Bascule bridge
Punta Gorda / Port Charlotte
Shell point / Harbor Heights on the Peace River
This is an explanation of how and why the tides do what they do here.
In each area the tides will be different times, often different from low or high
Read down the page for pictures and
explanations
Tides for Charlotte Harbor -
This is very confusing for people who
lived by an ocean. On an ocean, you have four tide changes a day. Simple - every 6
hours or so it changes.
NOT Here. In 24 hours, there could be 1-2-3-4-5 changes
in a normal day. Zero and six changes are possible, although I have not seen that yet.
This has
something to do with water currents in the Gulf, or maybe, when the tide comes
in from the Atlantic, it simply sloshes back and forth?
OK, let's get to the tides. We exchange about 2 feet of water during a 24-hour
period in Charlotte Harbor. The term "HIGH" is used to describe the most water
during that time - not implying that the water will be high, or deep.
The same
applies to "LOW." This is the lowest the water will be for that time. Highs and
lows are only for reference. Or if you are stuck on a sand bar.
After high tide, then the tide is "outgoing"
until it reaches it lowest point (which is low tide). After low tide, it is "incoming" until
the next
high tide.
To know how much water you will have look after the time. 0.0 is
MLLW = mean
lower low water. You don't need to know exactly what that means, except this
part: All charts depths are measured from MLLW. So where a chart shows 3 feet of
water, that's at a 0.0 low tide. If the tide is a 2.0 high tide, there should
(in theory) be 5 feet of water where the chart shows 3.
Your house and land-based objects are measured from mean high water, which is
basically an average high tide. In our case, 2.0 feet is
the normal mean high for the area.
0.0 is the same every where. The high changes every place you go,
As I said, our mean high is 2.0. The water can be higher or lower than this height
at high tide. The average is about 1.0.
Keep in mind that some high tides will be lower than some low tides, and vice-versa.
Best bet: Look at a chart. The only way a tide clock works in Charlotte
Harbor is if
you hang it over the water at low tide. The wetter it gets, the higher the
tide.
Notes from me.
If you want to fish the incoming
tide, get out at low tide.
If you plan to fish the outgoing, you want get there at high tide.
Flats fishin:
You should always go on the flats at low tide. That way you always have more
water coming in. When the tide, goes out so should you! (Or you might not get
out off the flats. Don't ask me how I know this.)
When is the tide best for fishing?
One question, many answers.
Well, I would start with moving water. That seems to be the key to catching fish. Whether the tide is going out or coming in, moving water is what we want most of the time. There are a couple of instances, like sheepshead or snappers on reefs, when a stalled or stopped tide can make the fish look around more rather than just looking into the oncoming water. A slack tide may or may not make reef fish hit better. This is not the rule, but if I am fishing and the tide stops and the bite stops too, I will head to a reef and see if the snappers or sheepshead will make my day.
Is the incoming or outgoing tide better?
Good question, but this about the time of year or weather
conditions.
Let's start with summer. Here in S.W. Fla., the summers are hot and we get a lot
of rain. We need to get a lot of rain, as the sun evaporates 50 inches of water
from the lakes, So we need 50 inches of rain a year to break even.
OK, why are rain and heat important? Well, the rain creates runoff and higher
water flow in the rivers. The top of Charlotte Harbor is really the mouths of
two rivers. The Peace River which is well over 100 miles long and the Myakka
River close to 100 miles long. These rivers dump millions of gallons of
freshwater a minute.
So all that freshwater dilutes the salt content and it become brackish. The
other thing is that the fresh water from the rivers is brown colored from the
tannic acids in the leaves of the plants, It is not really as dirty as it is
more like a cup of tea
dyed brown. and that brings us to heat. Clear water reflects the sun light
keeping it cooler, but brown water is a solar collector
and gets very hot much faster. Hot water will not retain oxygen, So hot fresh or
brackish water with very little oxygen. is what we
are dealing with most summer.
So Summer time is about in-coming tides the clear waters of the gulf of Mexico
stay cooler than the brown waters, of Charlotte harbor.
As the tide comes in, it brings cooler water with more oxygen and salt with it.
Now the salt it brings in gets the tiny bait stirred up or lets say refreshed.
and it starts to move and feed which in turn makes the larger creatures start to
feed. And the whole food chain kicks in.
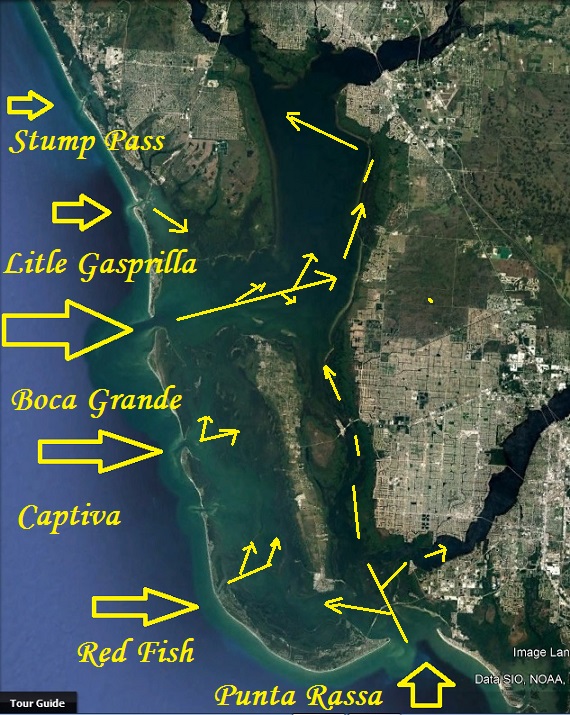
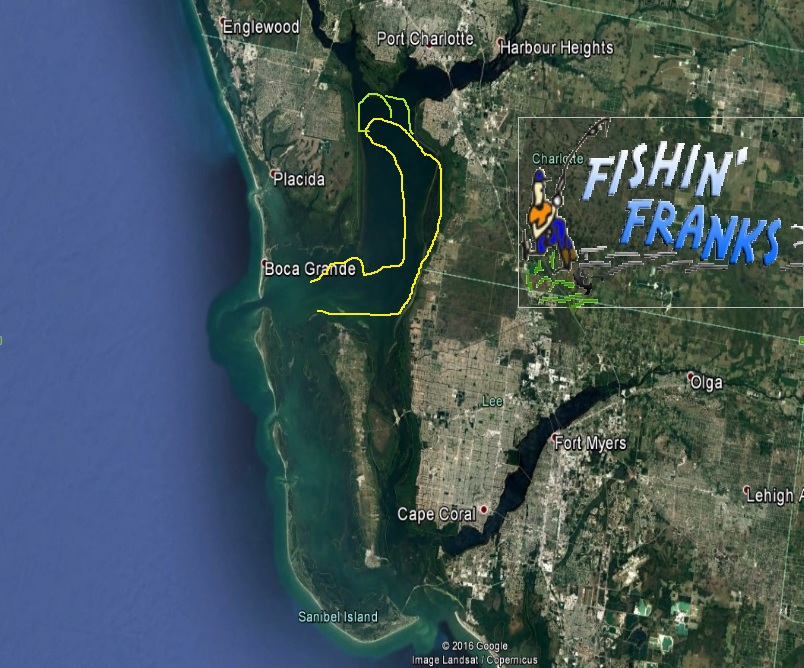
How the tide comes into Charlotte Harbor.
The Tidal flow that comes in from Boca Grande Pass which is the Pass we get most
of our water
flow through, Flows almost straight across to the east side, As there is three
passes to the south
of it which are also letting water into the Harbor. One the flow hits the east
side the flow from Punta Rassa
combine up past Matlacha pushes the water up the east side, if the tide is long
enough lets say 6 hours or more
the flow will hit Punta Gorda, then defect towards the mouth of the Myakka
River.
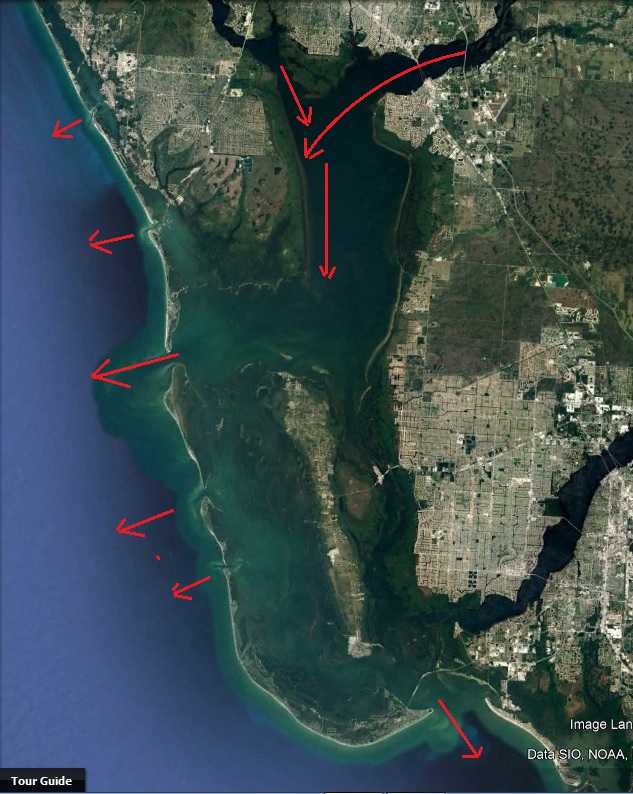
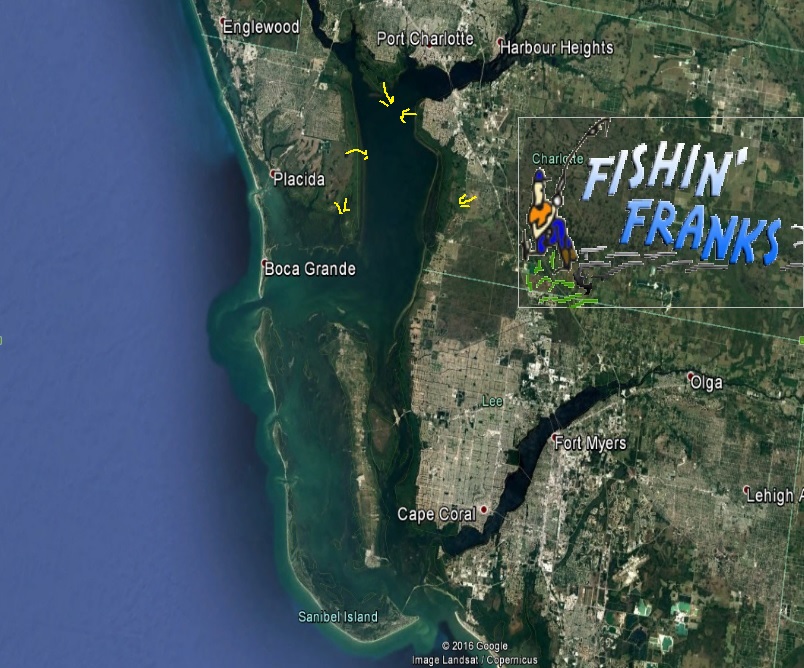
How the water is pulled out of Charlotte Harbor on the out going
tide.
The out going tide starts at Boca Grande and the other passes the water is
"pulled" out from the
harbor more so than anything. I would have thought the in-coming tide would
start at the passes
and then the water would start going out from The top of the Harbor first. Nope
wrong!
The tide starts going out at the passes as well, So weird little
point but need to know.
Now as the water is going out of the Harbor after lets say a 6 hour tide where
the salt water
From the gulf has made it's way to the mouth of the Myakka
Here the Red lines show as the rains begin the may be split into
two section the red part mostly salt water from out going tides,
and would be very brown colored.
The Yellow part is clear salty water from in-coming tides.
often in the spring and fall you can see the difference as you drive
across the Harbor. from side to side
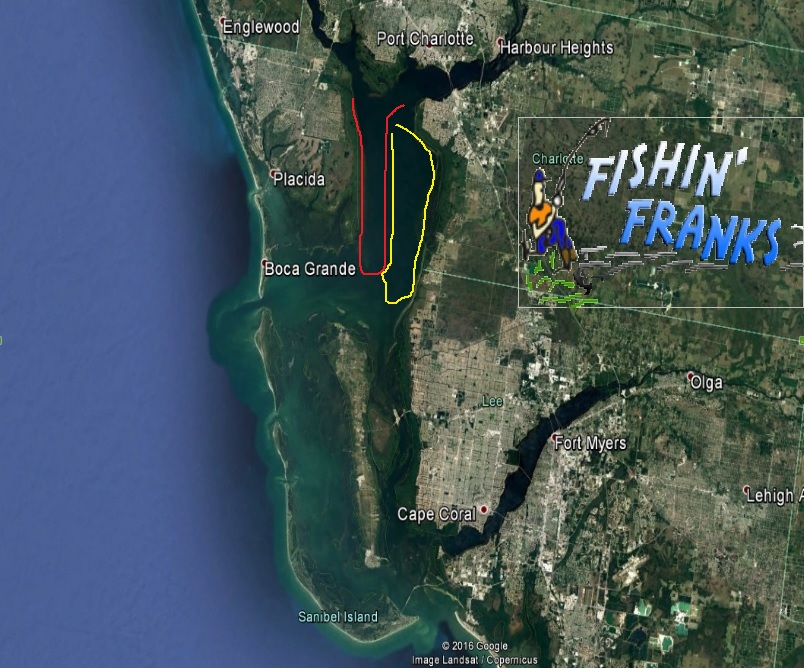
Here you can see how the out going tide would move the salt
water, that came in on an in-coming
tide down the west side, replacing it with fresh water pulled from the rivers
So summer time the first part of the out going tide the fishing on the west side
is going to be better
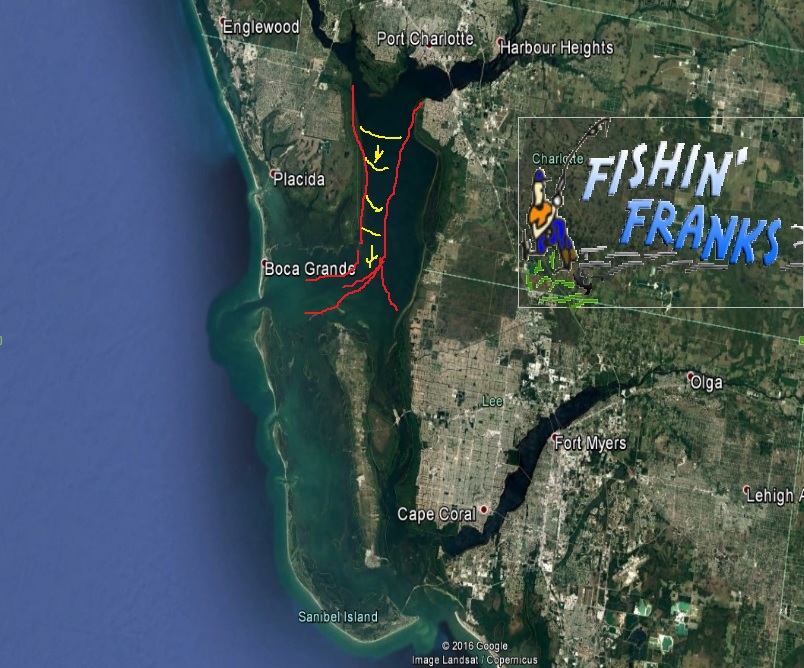
Here you can see how the water comes in and that makes the east
side better on an in-coming tide,
the last part of the in-coming tide would make the cut-off and the Myakka River
good places to fish.
Winter time , no rain clearer water in the Harbor, So things
change the in-coming tide
brings in colder water from the gulf, not good for Tropical fish like ours.
So the out-going tide, is the tide to fish.
Why well the out going tide pulls water from the creeks and canals, as well as
shallow tidal pools
where there is black bottom and brown water which collects heat from the sun.
and when the tide goes out it pulls that warmer water out from these places and
gives the Bait
a refresh and the fish a kind of kick start to start feeding.
Now what about the time where, the gulf temp and the Harbor temp
are about the
same. and there has been no rain for a month or so.
which tide is best. Pick one it is the same, weather coming in or going out.
all you need is the water to be moving.
Why
is the tides different heights during part of the year
![]()
When should I go fishing? What's the best tide?
When is high tide is the most
asked question I get, I tell them the time of the high tide here at the Top of
Charlotte Harbor. Funny though they never ask the height of the tide? Here in
our area High tide does not mean you have a lot of water, It only means that all
you get for now. Many times Highs do not have as much or any more water depth
then some low tides, Yes Fall & winter high tides are not as high as Spring or
summer lows, We have an average of 1 foot more water Spring and summer than we
do Fall or winter. I figure 1.5 or high is a high tide .9 to 1.5 medium tide,
0.0 to .9 low anything below a 0.0 is well a good day to hunt for lure you stuck
on the bottom as most of the harbor is dirt anyway.

This is the Crimson tide,
Not to be confused with Red tide.
People assume that they should fish the high tide? Why I have as many good low
tide spots which are actually easy fishing than high tide. When the water is
very high the fish scatter or go way back up under the Mangroves, On very low
tides the are in the holes. Like shooting fish in a barrel they have to be
there.
Lets talk about right now. We have had Rain keep in mind it does not matter too
much if it rains in Port Charlotte or Punta Gorda it is up-river which makes the
big difference. Rains fill there rivers all that Fresh water stained dark with
Tannic flows out of the rivers into the Harbor. The Peace, The Maayka, and the
Caloosahatchee all empty into Charlotte Harbor, Which is why this area is called
brackish water. which simply means salt water diluted by rain or river runoff,
it is still salt water after the rain stops. So when is the best time to fish?
Lets look at it.
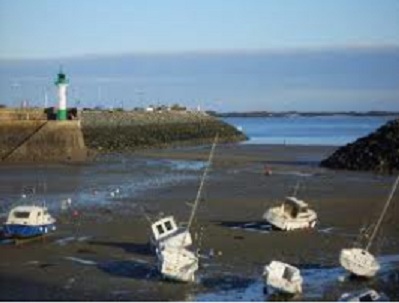
High and low tides in some
places
are really drastic, like here where
the changes are 15 to 40 feet.
In our area we only exchange
2 feet
a day on the average.
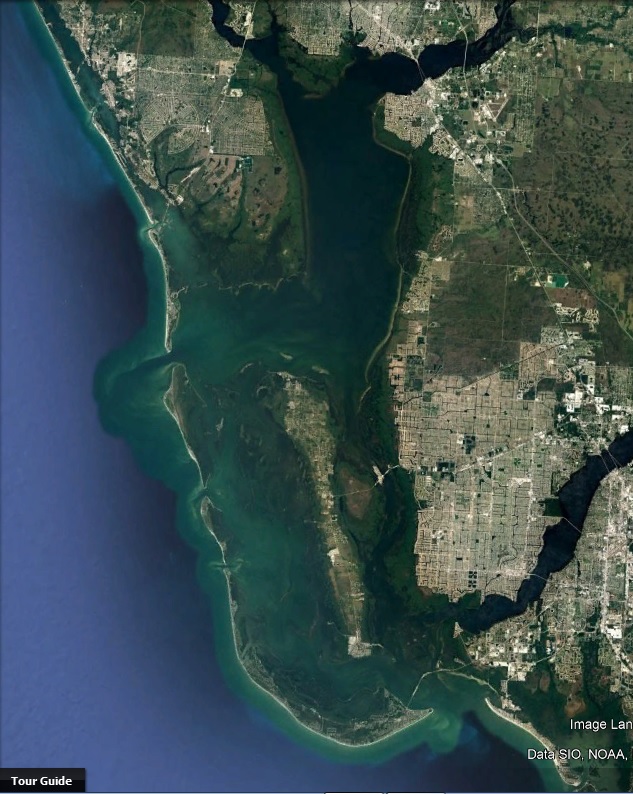
So you would see this here.
High tide once the water reaches
it's peak, the it starts to go out, Pulling the Hot fresh dark water from the
rivers, Consider that salt is heavier than water so the only place out there
with any salt is right by the bottom where the sand holds the salt. The water
from the rivers is fresh and hot. It is important to remember that hot water
does not hold much oxygen. So it is hard for fish to breath. Much like you in
the sun you don't want to move, much less eat, Then
Low tide comes, and the tide starts pushing cooler saltier water in from the
gulf of Mexico,
up into the Harbor, it is like flipping a switch, they bait which had been
hiding near the bottom to be in the salt come back to the surface, the fish get
active, everything starts to happen.
Here you can see how low the
water is.
on a high tide the water is level
with the branches of the mangroves.
On a day like this, you
would look for deeper
troughs just at the edge of the mangroves,
That is where the Red Fish will be.
This is in the Myayaka Cut off.
Greg caught this Red on a
live shrimp
free lined up by the edge of the mangroves.
So if you are planning a trip
during August look to get out at low tide, take advantage of the incoming tide,
I usually figure the last half of the incoming & the 1st 3rd of the outgoing to
be the best fishin. I like to be there get set up and then when the salt water
hits and every thing starts to happen I am ready. Let the fun begin.
It is hard for many people to
realize that fish have about the same ability to smell as dogs. So now that we
have talked about the dark hot water, lets look into the water, all 2 or 3
inches that we could see into it. How far do you think the fish can see? that is
why I started with the smell thing, yes fish are hunters / predators So if you
cannot see even if you can you still use your nose and ears to find food. Dead
bait such as frozen shrimp has a much more potent aroma to it, That makes it
better bait in very dark or dirty water, The live bait of it is moving has the
less of a scent but the movement in the water makes vibrations or sounds if you
think of it that way to attract predators the hook makes their movements erratic
wounded good to eat but easier to catch. If you have enough salt in the water
you have lively bait, but with low salt content in the water the bait is
lethargic and not a good predator attractor,
So I would put my money into dead stinky baits. The guides who are catching the
most Tarpon during the last few weeks are using Mullet cut into large chunks so
big the cat fish cannot get it in their mouths and the Tarpon can. Yes that dead
stinky bait is going to attract Cat fish just use big chunks like 1/2 of a
mullet at a time. The cat fish start moving it around and the Tarpon will move
in and take it from them. Cat fish are Tarpon food as well So it really dose
work.
So incoming tides and dead bait, I guess I could have said it all in just that sentence but where the fun in that, Good luck out there.